Atrium Evolution Risk Targeted - AEF 9 P
As at 31 March 2026
Features
Information
Ratings & awards

A rating is only one factor to be taken into account when deciding whether to invest.
Investment objective
To maximise returns while ensuring portfolio risk, or volatility, does not exceed 9% over a rolling three (3) year time period.
Investment strategy
The Fund has a Risk Targeted, multi asset investment strategy.
Atrium uses a dynamic, unconstrained approach to asset allocation providing flexibility to take full advantage of opportunities in the market and to mitigate downside risk.
The Fund may be invested in a broad universe of assets across multiple asset classes.
Atrium may also use derivatives to gain exposure to assets or asset classes more efficiently, for currency management, and to mitigate downside risk.
Building portfolios that smooth out volatility
Atrium’s Risk Targeted investment approach aims to offer investors a smoother investment journey. By challenging conventional thinking and allocating to a wide array of investments, we construct truly diversified portfolios that seek to maximise opportunity and manage risk.
During market downturns we focus on minimizing losses to help investors achieve consistent growth over the long-term with less volatility. This is important to us because we care about the entire investment journey, not just the destination.
Our disciplined process is underpinned by three core principles that have enabled us to effectively pursue our investment objectives over a long time horizon.
Focus on risk first
Seek consistency of returns
Seek to preserve capital
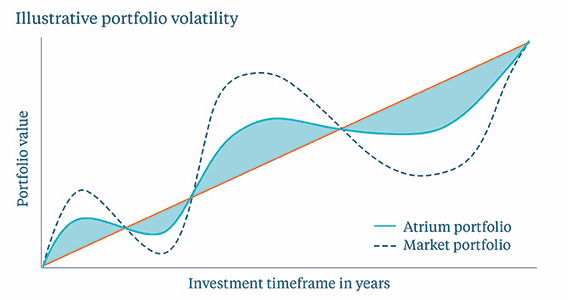
Source: Atrium, for illustrative purposes only. This graph is not a guarantee of future performance and undue reliance should not be placed upon it.
Important Information:
Marketing Name: Atrium Evolution Risk Targeted Fund
Registered Name: Atrium Evolution Series – Diversified Fund (ARSN 151 191 776)
The information in this document (Information) has been prepared and issued by Atrium Investment Management Pty Ltd (ABN 17 137 088 745, AFSL 338 634) (Atrium). The Trust Company (RE Services) Limited (ABN 45 003 278 831, AFSL 235 150) is the Responsible Entity of the Atrium Evolution Risk Targeted Fund (Fund). The Information is of a general nature only and does not take into account the objectives, financial situation or needs of any person. Before acting on the Information, investors should consider its appropriateness having regard to their own objectives, financial situation and needs and obtain professional advice. No liability is accepted for any loss or damage as a result of any reliance on the Information. Investors should consider the Fund’s PDS and Target Market Determination (TMD) (available from www.atriuminvest.com.au) before making any investment decision. Past performance is not a reliable indicator of future performance. Future performance and return of capital are not guaranteed.
The ratings published 04/2025 Atrium Evolution Series – Diversified Fund AEF 5, 04/2025 Atrium Evolution Series – Diversified Fund AEF 7, 04/2025 Atrium Evolution Series – Diversified Fund AEF 7P Units, 04/2025 Atrium Evolution Series – Diversified Fund AEF 9, 04/2025 Atrium Evolution Series – Diversified Fund AEF 9P Units are issued by Lonsec Research Pty Ltd ABN 11 151 658 561 AFSL 421 445 (Lonsec Research). Ratings are general advice only, and have been prepared without taking account of your objectives, financial situation or needs. Consider your personal circumstances, read the product disclosure statement and seek independent financial advice before investing. The rating is not a recommendation to purchase, sell or hold any product. Past performance information is not indicative of future performance. Ratings are subject to change without notice and Lonsec assumes no obligation to update. Lonsec Research uses objective criteria and receives a fee from the Fund Manager. Visit www.lonsec.com.au for ratings information and to access the full report. © 2025 Lonsec. All rights reserved.
Powered by data from FE fundinfo
Source: Atrium Investment Management, Bloomberg. Inception date is 11/11/2022. Past performance is not a reliable indicator of future performance. Future performance and return of capital are not guaranteed. Performance figures are based on input data available as at the date of this report. Performance is after fees and costs and assumes re- investment of all distributions. Return objectives are set out in the Fund’s Product Disclosure Statement (PDS). Note that the internal return objectives for AEF 7P Units and AEF 9P Units align to the performance return hurdles for these Units (as set out in the PDS for these performance-based fee products). Please refer to the Fund’s PDS for more information on returns.
Performance
| Since inception (% p.a.) | 10 Years (% p.a.) | 7 years (% p.a.) | 5 years (% p.a.) | 3 years (% p.a.) | 1 year | 6 months | 3 months | 1 month | |
|---|---|---|---|---|---|---|---|---|---|
| Portfolio | 7.44% | 7.44% | 7.57% | -2.19% | -2.80% | -5.04% | |||
| Objective | 8.48% | 8.58% | 8.27% | 4.00% | 1.98% | 0.69% |
Objective refers to the Return objective as stated in the Key Facts table.
Important Information:
Marketing Name: Atrium Evolution Risk Targeted Fund
Registered Name: Atrium Evolution Series – Diversified Fund (ARSN 151 191 776)
The information in this document (Information) has been prepared and issued by Atrium Investment Management Pty Ltd (ABN 17 137 088 745, AFSL 338 634) (Atrium). The Trust Company (RE Services) Limited (ABN 45 003 278 831, AFSL 235 150) is the Responsible Entity of the Atrium Evolution Risk Targeted Fund (Fund). The Information is of a general nature only and does not take into account the objectives, financial situation or needs of any person. Before acting on the Information, investors should consider its appropriateness having regard to their own objectives, financial situation and needs and obtain professional advice. No liability is accepted for any loss or damage as a result of any reliance on the Information. Investors should consider the Fund’s PDS and Target Market Determination (TMD) (available from www.atriuminvest.com.au) before making any investment decision. Past performance is not a reliable indicator of future performance. Future performance and return of capital are not guaranteed.
Powered by data from FE fundinfo
Asset allocation
| Rates & credit | 3.46% | |
| Australian equities | 19.13% | |
| International equities | 45.30% | |
| Listed infrastructure | 4.10% | |
| Liquid alternatives | 15.99% | |
| Private markets | 12.02% |
Atrium aims to achieve its investment objectives by investing across a range of asset classes on a global basis that provide exposure to different risk factors.
Each asset is included in the Portfolio for its ability to contribute to returns on a stand alone basis.
The investment universe comprises of 3 broad categories - Preservers, Growth Drivers and Diversifiers.
 | PreserversAssets that protect the portfolio during periods of heightened equity market volatility and preserve capital, such as cash, government bonds and high quality investment grade bonds. |
 | Growth DriversAssets that are expected to deliver higher rates of return over time with higher levels of associated volatility (risk). This predominantly comprises equities but also includes other assets that are highly correlated to equities such as listed property and infrastructure. |
 | DiversifiersAssets that generate additional real returns, with performance that is typically uncorrelated to the growth drivers and preservers within the portfolio.Importantly, they are a source of portfolio diversification away from equity market and interest rate risks, such as liquid alternatives and private markets. |
Important Information:
Marketing Name: Atrium Evolution Risk Targeted Fund
Registered Name: Atrium Evolution Series – Diversified Fund (ARSN 151 191 776)
The information in this document (Information) has been prepared and issued by Atrium Investment Management Pty Ltd (ABN 17 137 088 745, AFSL 338 634) (Atrium). The Trust Company (RE Services) Limited (ABN 45 003 278 831, AFSL 235 150) is the Responsible Entity of the Atrium Evolution Risk Targeted Fund (Fund). The Information is of a general nature only and does not take into account the objectives, financial situation or needs of any person. Before acting on the Information, investors should consider its appropriateness having regard to their own objectives, financial situation and needs and obtain professional advice. No liability is accepted for any loss or damage as a result of any reliance on the Information. Investors should consider the Fund’s PDS and Target Market Determination (TMD) (available from www.atriuminvest.com.au) before making any investment decision. Past performance is not a reliable indicator of future performance. Future performance and return of capital are not guaranteed.
Powered by data from FE fundinfo
Top holdings
| Holding | Weight | Asset Class |
|---|---|---|
| RUSSELL AUSTRALIAN EQUITY OPPORTUNITIES FUND | 19.30% | Australian equities |
| ANTIPODES GLOBAL FUND | 9.60% | International equities |
| ISHARES MSCI USA EQUAL WEIGHTED ETF | 7.16% | International equities |
| S+P500 EMINI FUT JUN26 | 6.30% | International equities |
| FAIRLIGHT GLOBAL SMALL & MID CAP FUND | 6.04% | International equities |
| CROWN ATRIUM SEGREGATED PORTFOLIO | 4.16% | Liquid alternatives |
| RUSSELL GLOBAL LISTED REAL ASSET FUND | 4.14% | Listed infrastructure |
| VANGUARD S&P 500 ETF | 3.98% | International equities |
| KEYVIEW PRIVATE CREDIT FUNDS | 3.60% | Private markets |
| VANGUARD FTSE EMERGING MARKETS ETF | 3.34% | Emerging markets |
Important Information:
Marketing Name: Atrium Evolution Risk Targeted Fund
Registered Name: Atrium Evolution Series – Diversified Fund (ARSN 151 191 776)
The information in this document (Information) has been prepared and issued by Atrium Investment Management Pty Ltd (ABN 17 137 088 745, AFSL 338 634) (Atrium). The Trust Company (RE Services) Limited (ABN 45 003 278 831, AFSL 235 150) is the Responsible Entity of the Atrium Evolution Risk Targeted Fund (Fund). The Information is of a general nature only and does not take into account the objectives, financial situation or needs of any person. Before acting on the Information, investors should consider its appropriateness having regard to their own objectives, financial situation and needs and obtain professional advice. No liability is accepted for any loss or damage as a result of any reliance on the Information. Investors should consider the Fund’s PDS and Target Market Determination (TMD) (available from www.atriuminvest.com.au) before making any investment decision. Past performance is not a reliable indicator of future performance. Future performance and return of capital are not guaranteed.
Powered by data from FE fundinfo
Market update
Global markets were dominated in March by a sharp escalation in geopolitical risk, which drove significant cross-asset volatility as growth and inflation fears clouded the economic outlook.
The primary catalyst was the intensification of conflict in the Middle East, which triggered a substantial energy shock. Oil prices moved above US$100 per barrel during the month, contributing to a rise in inflation expectations and renewed concerns around stagflation (slow growth, high inflation). This was accompanied by a broader increase in global food prices, as higher energy and freight costs flowed through supply chains.
Equity markets were volatile, early in the month global equities remained resilient, trading near highs, supported by still-positive earnings expectations and a constructive growth backdrop. However, as the energy shock intensified, markets experienced drawdowns, particularly in rate-sensitive sectors such as technology, while energy stocks outperformed on higher commodity prices. Dispersion across regions and sectors remained elevated, with emerging markets showing relative resilience year-to-date.
Bond markets reflected the shifting inflation and policy outlook. Globally, yields moved higher through March as investors priced a reduced likelihood of near-term rate cuts, with central banks globally adopting a cautious “on hold” stance in response to uncertainty. The prevailing narrative shifted toward “higher for longer” policy settings, particularly as inflation risks were revised upward and growth expectations modestly downgraded. The Reserve Bank of Australia signalled it was prepared to keep rates restrictive for longer if required. Australia’s lack of energy supply chain resilience was exposed, and the global backdrop of higher inflation risk and policy uncertainty led to a fall in the $A and equity market underperformance versus global equities.
Looking through the geopolitical noise, the global economy continued to exhibit resilient mid-cycle characteristics but is increasingly challenged. Growth remained supported by strong labour markets and earnings, but downside risks increased on inflation fears and tighter financial conditions.
Performance
A sharp sell-off in equities led the Fund lower in March as the Middle East conflict sparked the worst energy shock since the 1970s. The $A fell (US dollar rose) which provided some respite for offshore assets.
Equity markets were universally lower for the month. Hyperion Global Growth Companies Fund outperformed as some US tech names bounced, including ARM Holdings, the US based semiconductor company sitting in the centre of the AI buildout. It saw continued upward revisions to long-term growth expectations tied to AI demand. Antipodes Global Fund underperformed as Europe and cyclical sectors lagged, while Fairlight Global Small and Mid Cap Fund detracted as it tends to avoid the energy and materials sectors where the few bright spots were for the month.
In Australian equities, Firetrail Australian Small Companies Fund underperformed the smaller companies benchmark as its Amplitude Energy bet suffered as a gas well previously touted as a key source of growth was proven to be uncommercial. Ausbil’s energy and mining exposures were a mixed bag for the month with Sandfire Resources weaker on the fall in the copper price, while Origin Energy contributed positively on the rise in energy prices.
The liquid alternatives book held up well despite falls in trend following and global macro strategies. PE Commodities Strategy surged 11% as it was on the right side of some large moves in commodity prices. PE Global FX Alpha also saw strong returns on a US dollar bet versus the $A based on relative economic strength.
Government bond yields rose sharply, and credit spreads widened, hurting many fixed income strategies. The Atrium Enhanced Fixed Income Fund declined.
Portfolio changes
The Fund responded to increased volatility by adjusting hedges in currencies and interest rate duration, reducing Yen and increasing US dollar exposure, and reducing our sensitivity to higher US bond yields. We also increased equity tail risk hedges and took some profits on those at month-end.
Outlook
Despite the March drawdown our base case remains that the global economy is still in a mid-cycle expansion, supported by resilient labour markets, solid corporate earnings and generally healthy private sector balance sheets. Growth momentum, while moderating from prior peaks, remains intact, and we expect risk assets to recover as geopolitical uncertainty stabilises, and markets refocus on underlying fundamentals.
Important Information:
Marketing Name: Atrium Evolution Risk Targeted Fund
Registered Name: Atrium Evolution Series – Diversified Fund (ARSN 151 191 776)
The information in this document (Information) has been prepared and issued by Atrium Investment Management Pty Ltd (ABN 17 137 088 745, AFSL 338 634) (Atrium). The Trust Company (RE Services) Limited (ABN 45 003 278 831, AFSL 235 150) is the Responsible Entity of the Atrium Evolution Risk Targeted Fund (Fund). The Information is of a general nature only and does not take into account the objectives, financial situation or needs of any person. Before acting on the Information, investors should consider its appropriateness having regard to their own objectives, financial situation and needs and obtain professional advice. No liability is accepted for any loss or damage as a result of any reliance on the Information. Investors should consider the Fund’s PDS and Target Market Determination (TMD) (available from www.atriuminvest.com.au) before making any investment decision. Past performance is not a reliable indicator of future performance. Future performance and return of capital are not guaranteed.
Powered by data from FE fundinfo